Sponsored
Sponsor This Blog
Connect with a targeted audience of iOS developers and Swift engineers. Promote your developer tools, courses, or services.
Learn More →WWDC 2025 brought some changes to SwiftUI, and one of the notable additions is Chart3D. With this new API, you can now create interactive and customizable 3D charts directly in SwiftUI — no third-party libraries or complex SceneKit setups required.
In this post, I'll guide you through building 3D charts. If you're not familiar with Swift Charts, you can check my previous posts:
Preparing the data
As for every chart, we need data to display. We'll use a classic Iris dataset from Kaggle. It includes three iris species with 50 samples each as well as some properties about each flower. The CSV file contains the following columns:
Id,SepalLengthCm,SepalWidthCm,PetalLengthCm,PetalWidthCm,Species
1,5.1,3.5,1.4,0.2,Iris-setosa
...
Let's create a struct that will represent a single row of the dataset:
import Foundation

struct Iris: Identifiable {
    let id: Int
    let sepalLength: Double
    let sepalWidth: Double
    let petalLength: Double
    let petalWidth: Double
    let species: String
}
To parse the data, we'll use TabularData framework:
import TabularData

func parseIrisData() -> [Iris] {
    let fileUrl = Bundle.main.url(forResource: "Iris", withExtension: "csv")!
    let dataFrame = try! DataFrame(contentsOfCSVFile: fileUrl)
    return dataFrame.rows.compactMap { row in
        guard let id = row["Id"] as? Int,
              let sepalLengthCm = row["SepalLengthCm"] as? Double,
              let sepalWidthCm = row["SepalWidthCm"] as? Double,
              let petalLengthCm = row["PetalLengthCm"] as? Double,
              let petalWidthCm = row["PetalWidthCm"] as? Double,
              let species = row["Species"] as? String else {
            return nil
        }
        return Iris(id: id,
                    sepalLength: sepalLengthCm,
                    sepalWidth: sepalWidthCm,
                    petalLength: petalLengthCm,
                    petalWidth: petalWidthCm,
                    species: species)
    }
}
Creating the chart
Let's create an empty chart and parse the data:
import SwiftUI
import Charts

struct ContentView: View {

    @State private var irisData: [Iris] = []

    var body: some View {
        Chart3D {
        }
        .onAppear {
            irisData = parseIrisData()
        }
    }
}
At the moment, Chart3D supports 3 types of marks:
- PointMark;
- RuleMark;
- RectangleMark.
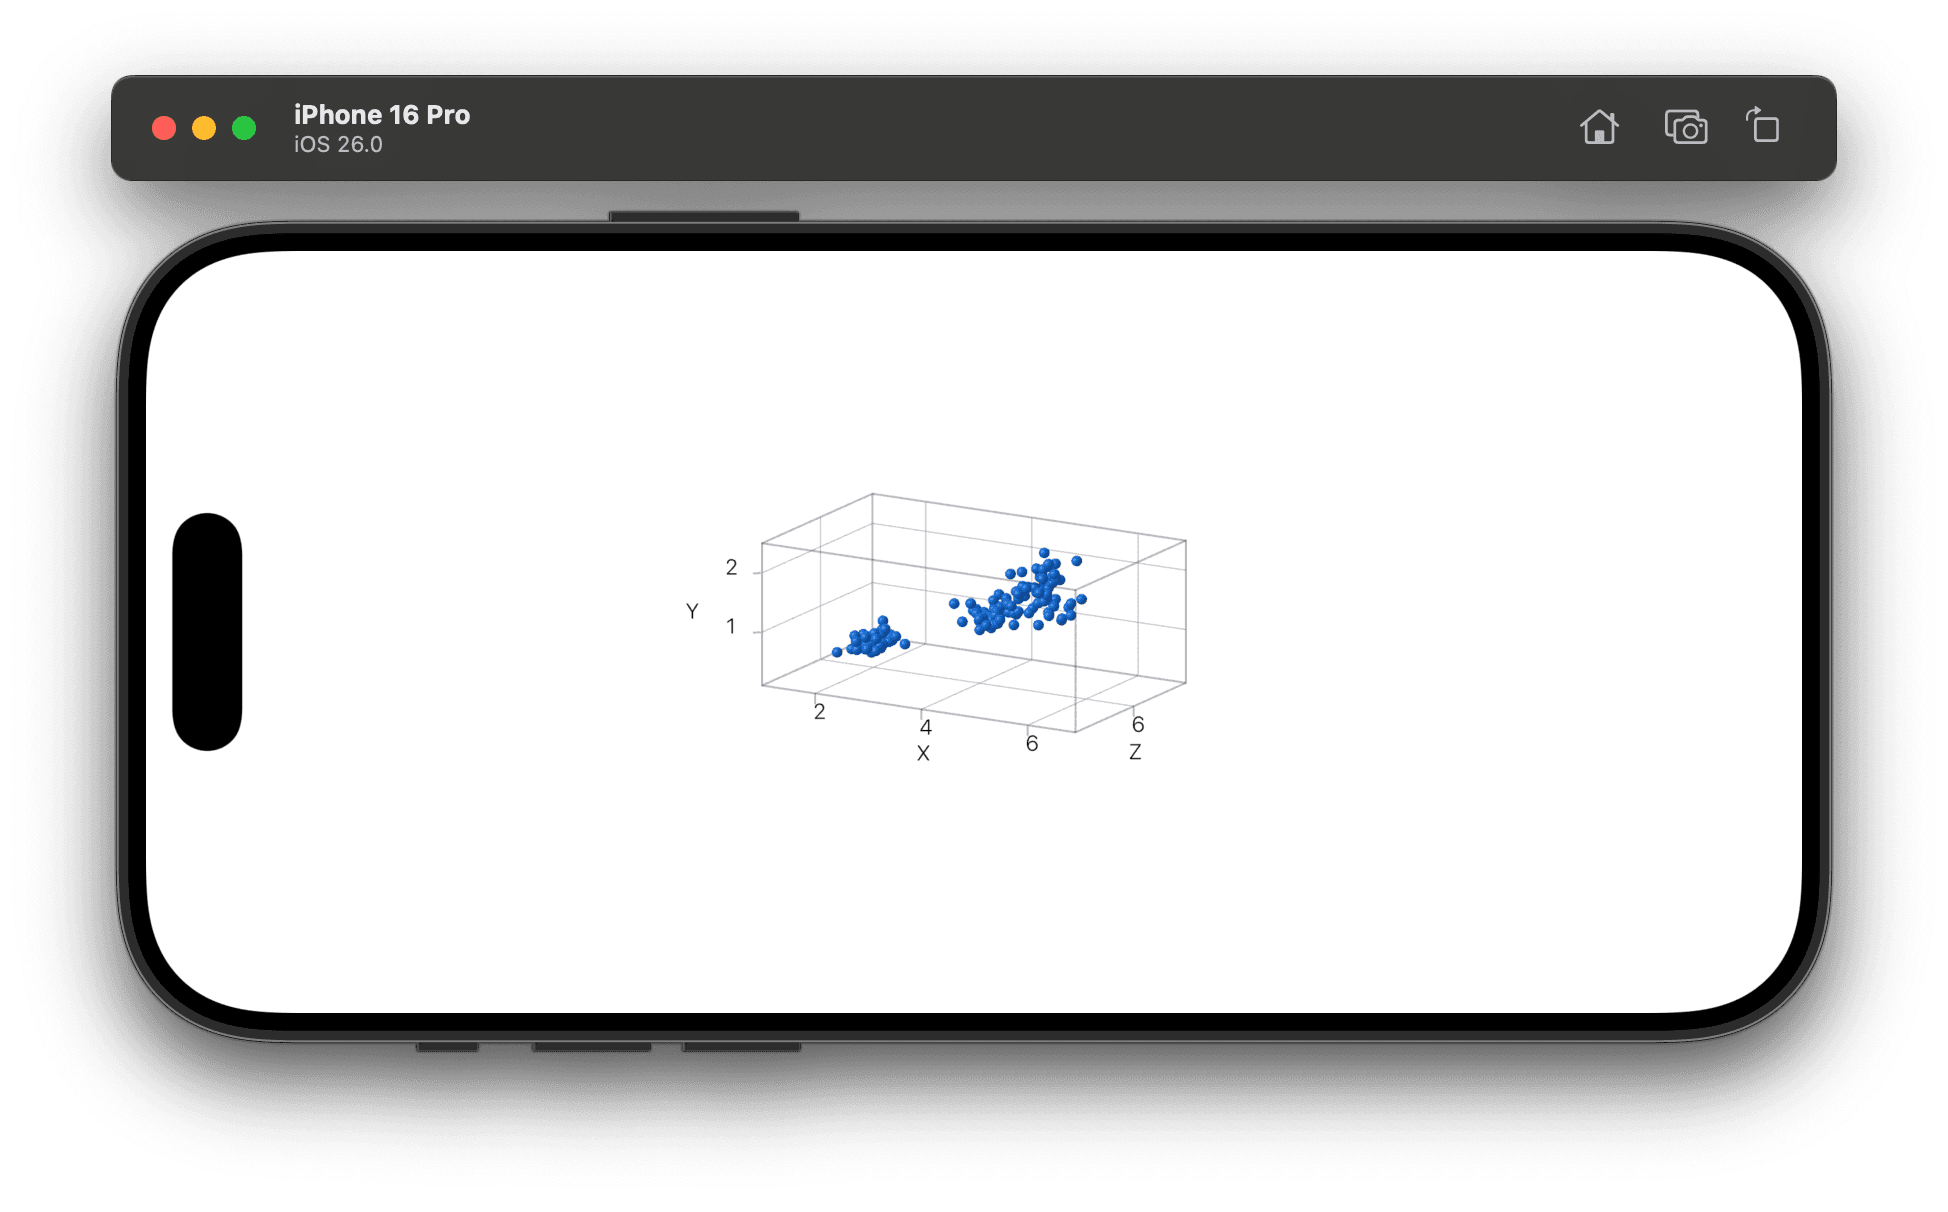
We'll use PointMark that will represent a single point in 3D space. Since iOS 26.0 beta, we can use a new initializer with three values:
Chart3D(irisData) { iris in
    PointMark(
        x: .value("Petal Length", iris.petalLength),
        y: .value("Petal Width", iris.petalWidth),
        z: .value("Sepal Length", iris.sepalLength)
    )
}
The dataset has 4 parameters, but we'll show only 3 of them.
Customizing the chart
We can customize scale of the chart by modifier for every axis:
.chartXScale(domain: 1...8, range: -1.5...1.5)
.chartYScale(domain: 0...3, range: -0.5...0.5)
// New in iOS 26.0 beta
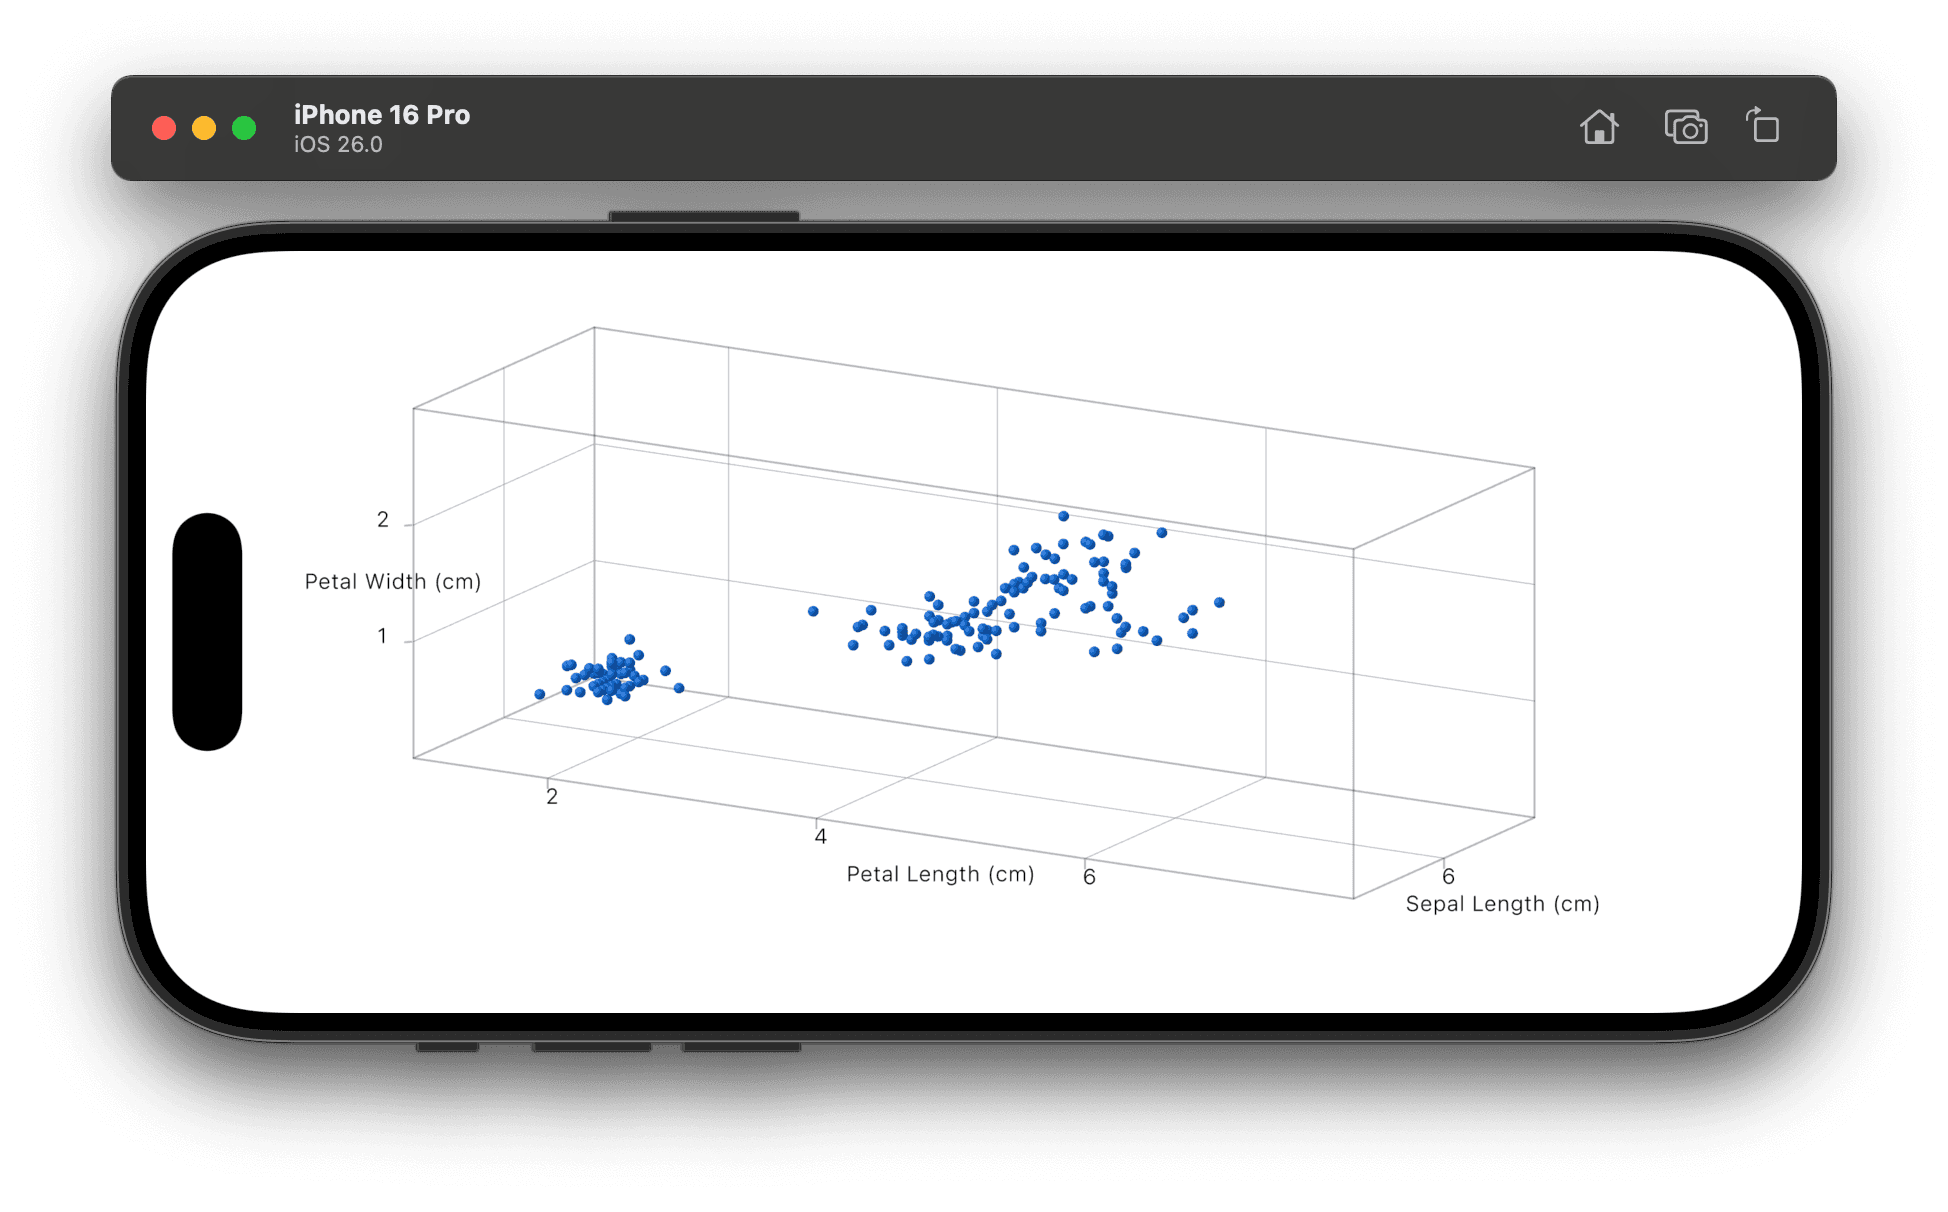
.chartZScale(domain: 4...8, range: -0.5...0.5)I chose these values to increase the size of the chart. We can also set axis labels to make the chart more readable:
private let xLabel = "Petal Length (cm)"
private let yLabel = "Petal Width (cm)"
private let zLabel = "Sepal Length (cm)"

Chart3D(irisData) { ... }
.chartXAxisLabel(xLabel)
.chartYAxisLabel(yLabel)
// New in iOS 26.0 beta
.chartZAxisLabel(zLabel)
The interesting thing here is that we can't set string literals directly, the labels won't be displayed. It looks like a bug for me, but I found this workaround in Code section of related WWDC session. I'll check it in next betas and update this post if needed.
There are also some brand new modifiers for 3D charts. chart3DCameraProjection modifier allows to change the projection of the chart:
.chart3DCameraProjection(.perspective)The default projection is .orthographic, we can change it to .perspective to emphasize depth of the chart:
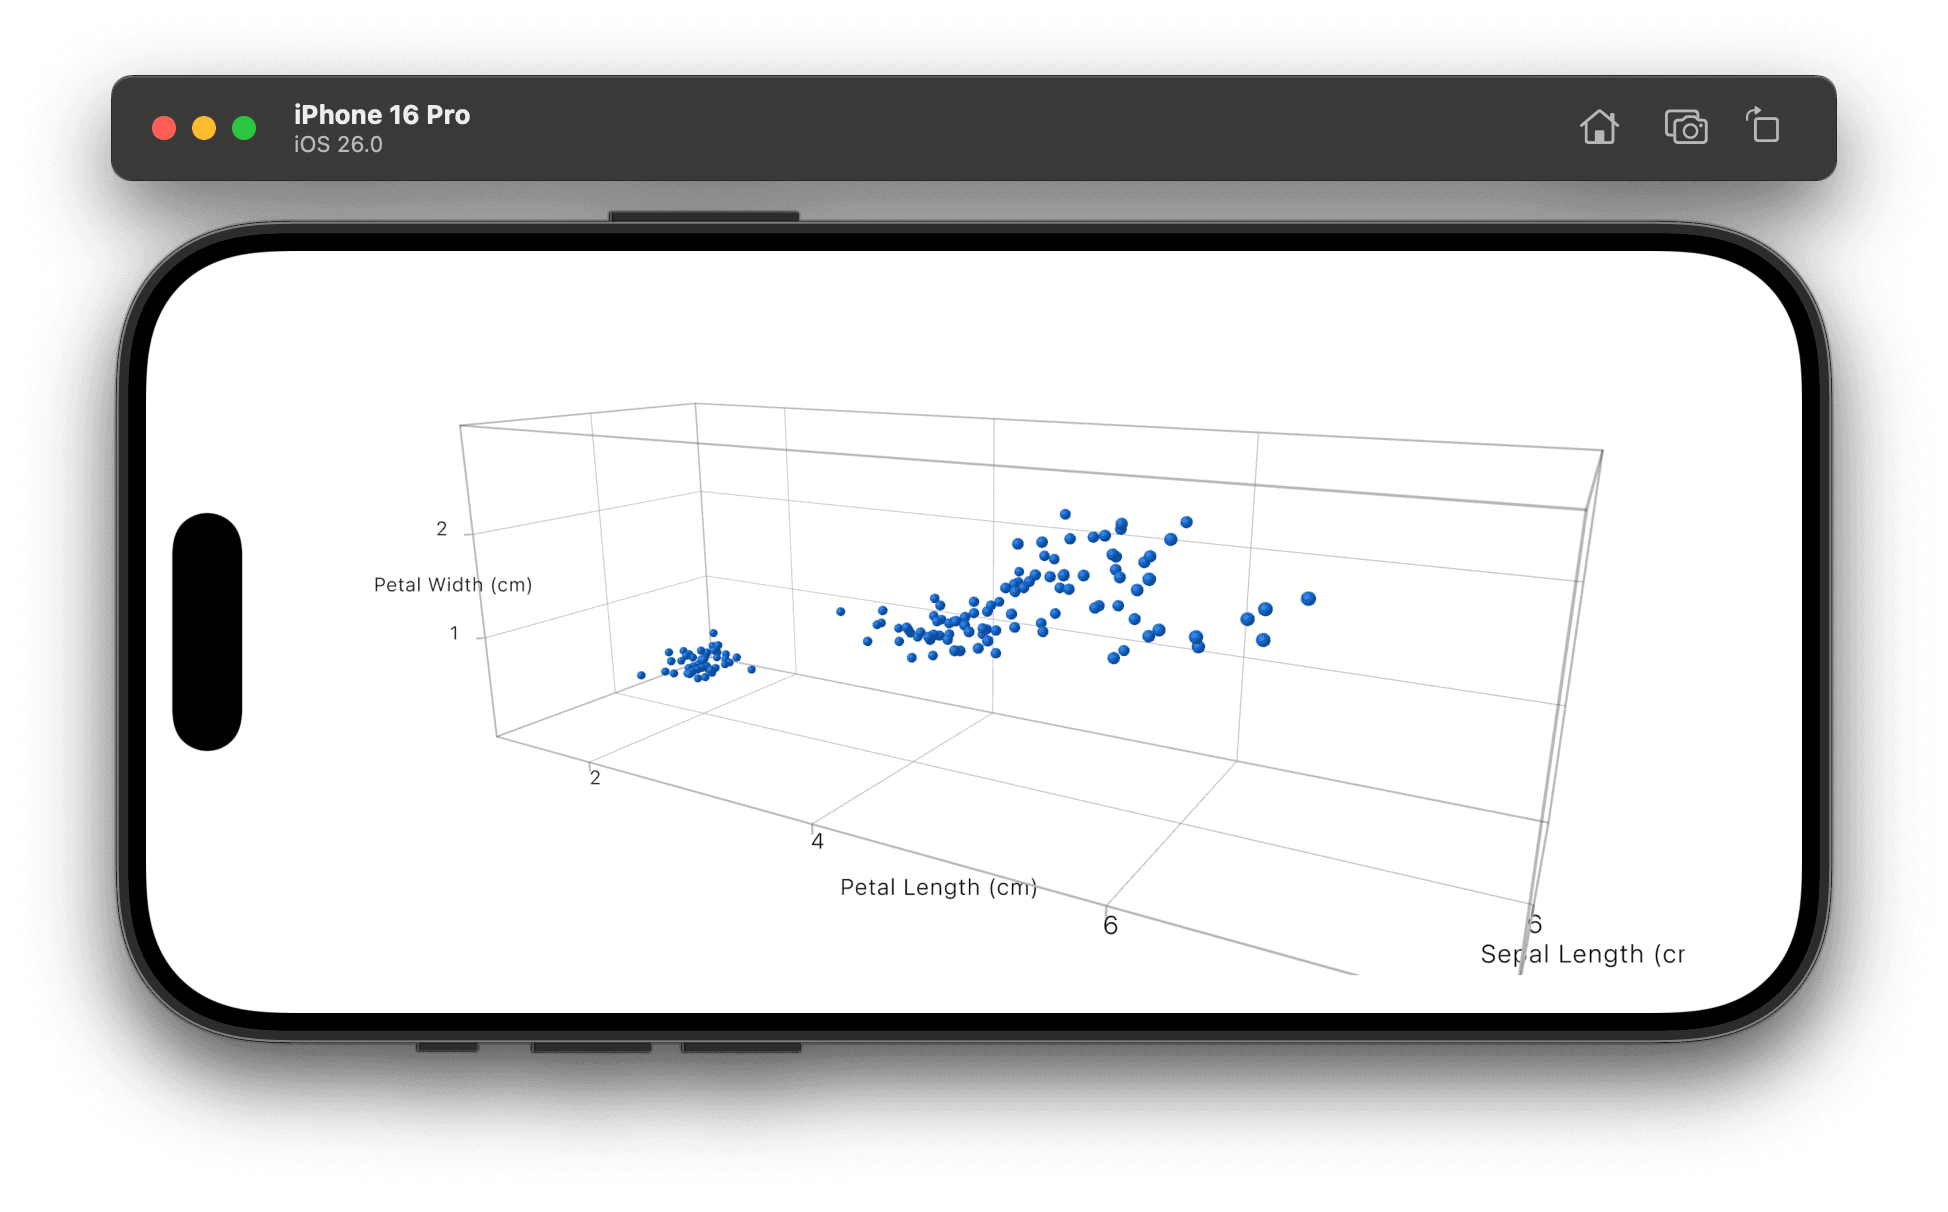
You may notice that some points are grouped together. We can change the foreground style of point marks to highlight the species:
PointMark(...)
.foregroundStyle(by: .value("Species", iris.species))
By default, the symbol is a sphere. We can change it to other shapes and sizes:
PointMark(...)
.symbol(.cube) // can be a sphere, cylinder, cone, or cube
.symbolSize(0.05)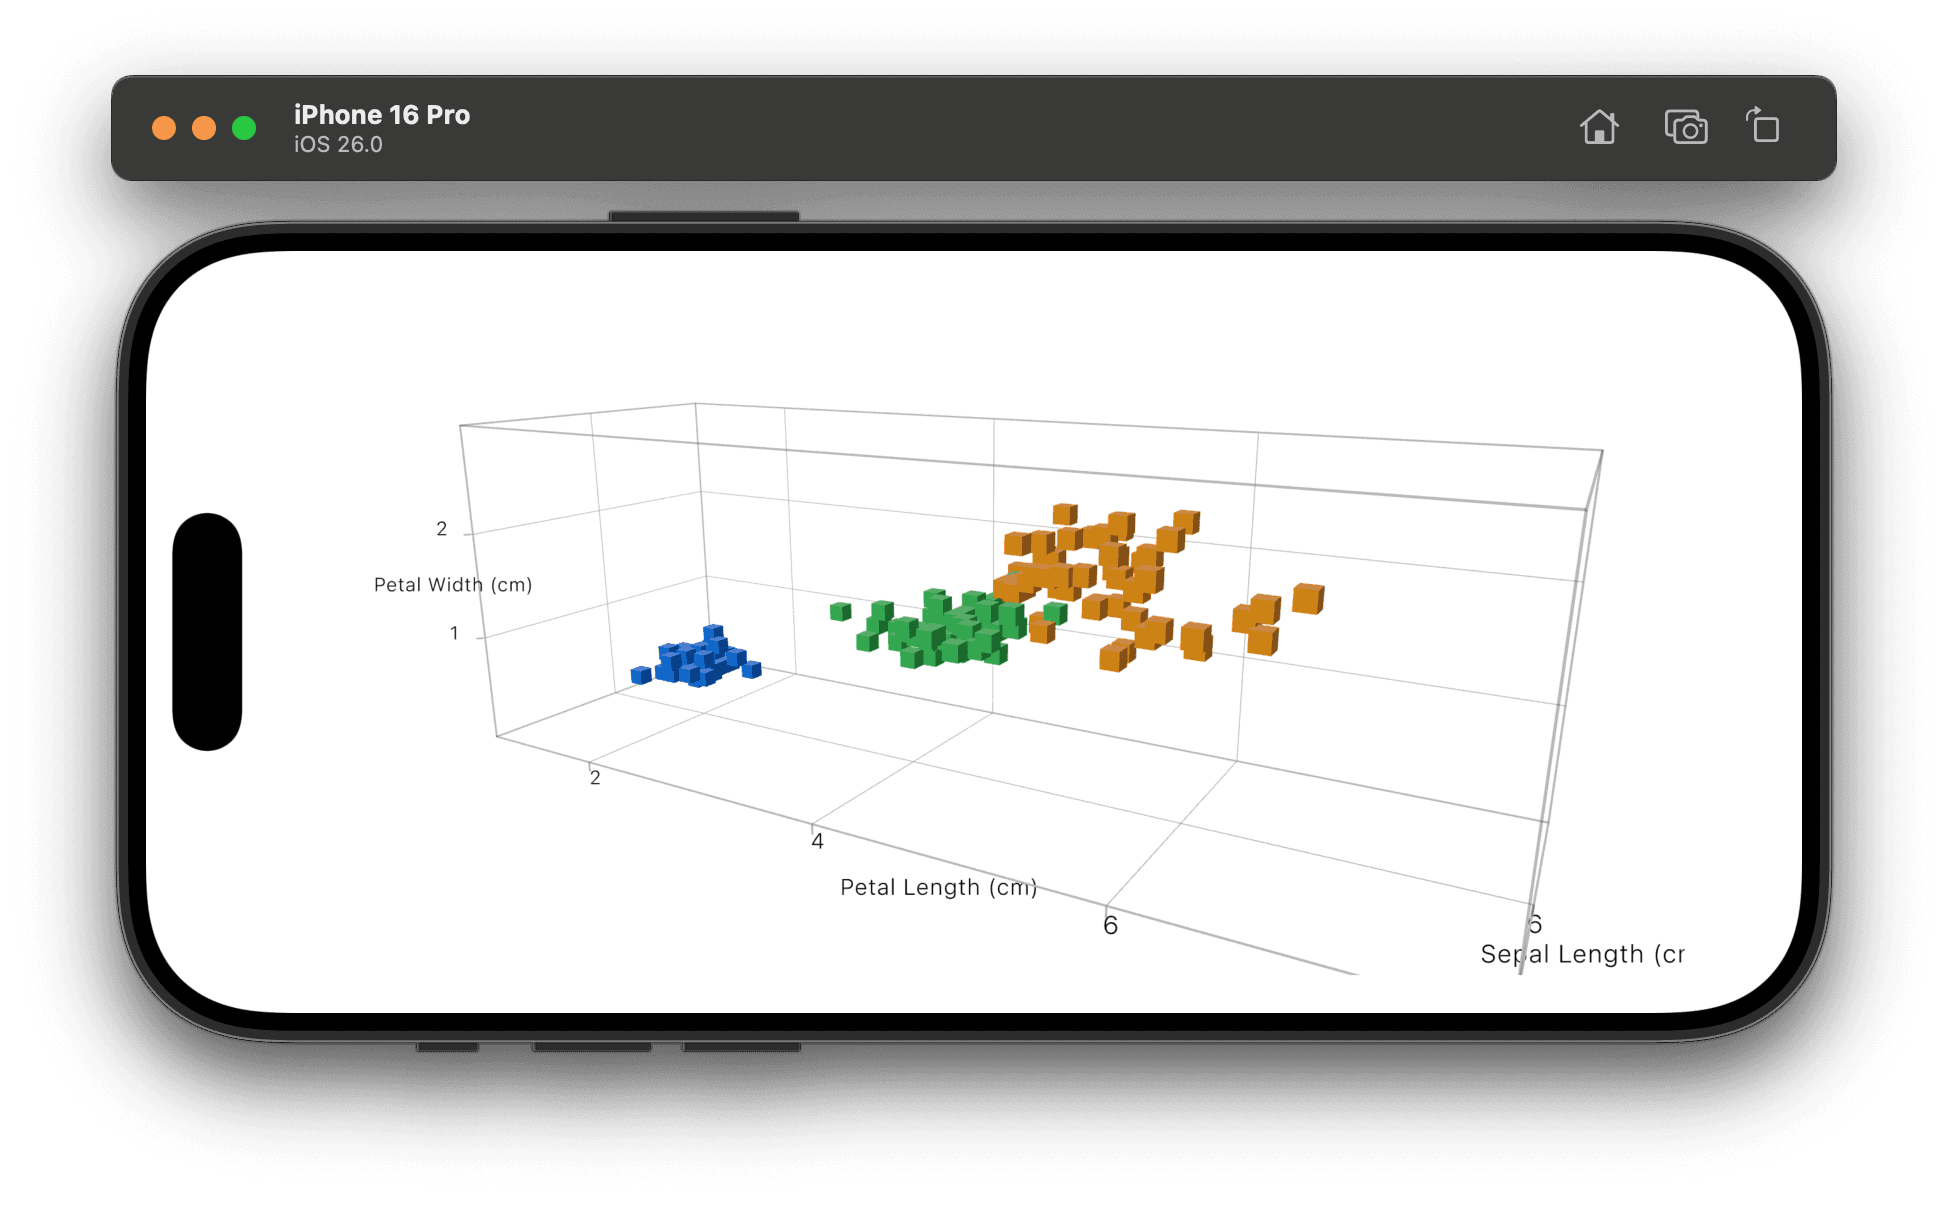
Changing the position
The perspective of 3D charts is very important. It allows to see the chart from different angles and emphasize the correlation between the data. With a new chart3DPose modifier we can change the position of the chart. You can use one of the predefined poses:
Chart3D(irisData) { ... }
.chart3DPose(.front)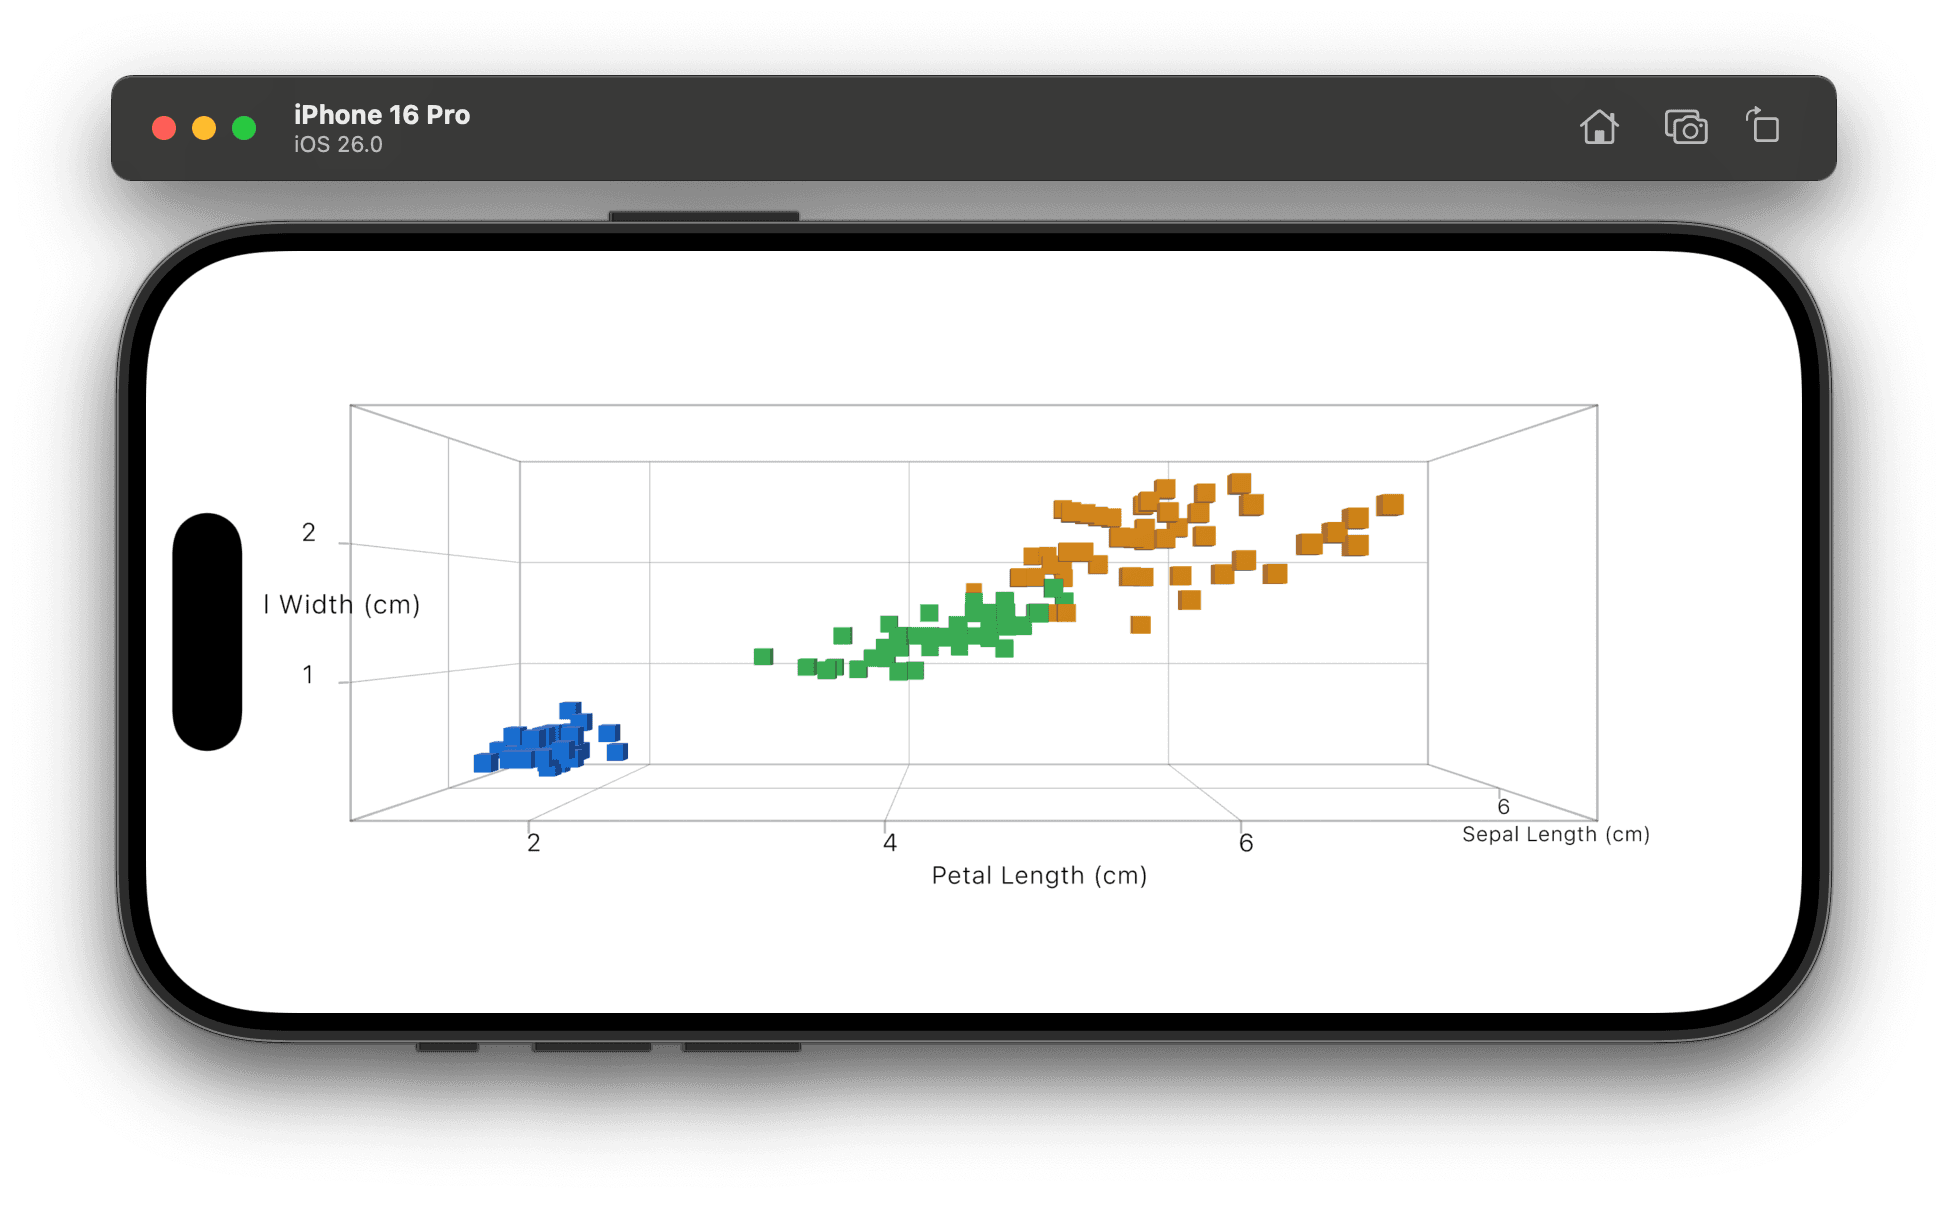
You can also create your own pose by using Chart3DPose struct:
.chart3DPose(Chart3DPose(azimuth: .degrees(0), inclination: .degrees(20)))Azimuth controls horizontal rotation; inclination controls vertical rotation.
Adding a binding to the pose state allows to change the position of the chart by user interaction:
@State private var pose = Chart3DPose(azimuth: .degrees(0), inclination: .degrees(20))

Chart3D {}
.chart3DPose($pose)
Now you can change the position of the chart by dragging your finger on the chart.
We can also change the pose automatically to create an animation:
// Required import for Angle2D
import Spatial

@State private var pose = Chart3DPose(azimuth: .degrees(0), inclination: .degrees(20))
@State private var azimuthAngle: Angle2D = .degrees(0)
private let timer = Timer.publish(every: 0.03, on: .main, in: .common).autoconnect()

Chart3D(irisData) { ... }
.chart3DPose($pose)
.onReceive(timer) { _ in
    azimuthAngle += .degrees(1)
    if azimuthAngle.degrees >= 360 {
        azimuthAngle = .degrees(0)
    }
    pose = Chart3DPose(azimuth: azimuthAngle, inclination: .degrees(20))
}
Chart3DPose has no azimuth property, so we need to store azimuth angle in a separate state. And here is the result:
Conclusion
The new Chart3D in SwiftUI opens new possibilities for data visualization. Whether you're plotting scientific data or interactive dashboards, 3D charts add depth — literally and visually — to your app.
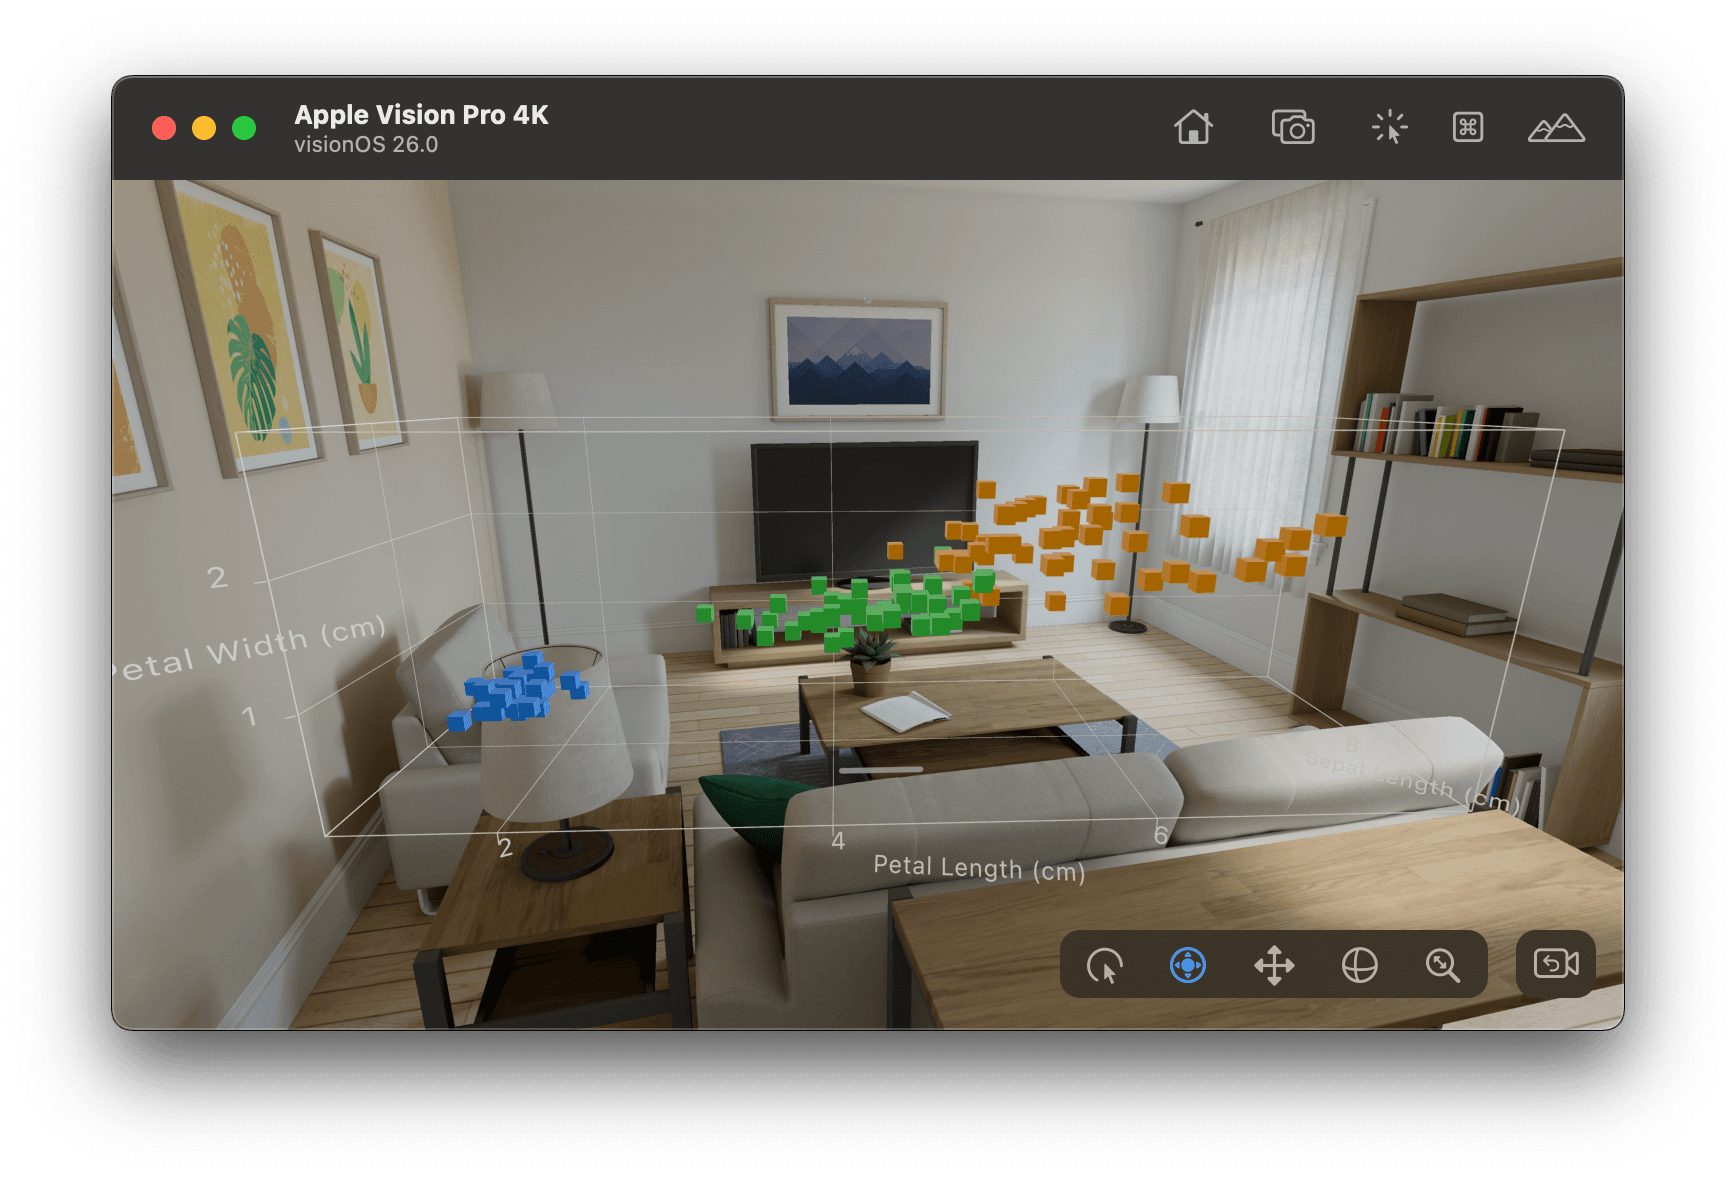
Moreover, if you're developing a visionOS app, you can use Chart3D to visualize the data as well.
The full code is available on GitHub.
References
- Chart3D documentation
- Iris dataset from Kaggle
- Bring Swift Charts to the third dimension from WWDC25